Gnuplot Lab
gnuplot
gnuplot is a tool that allows us to very quickly visualise data, it can be very useful for testing program output without having to generate complex graphical interface code, the following labs is going to use gnuplot to help visualise the output of several sample programs.
Getting started
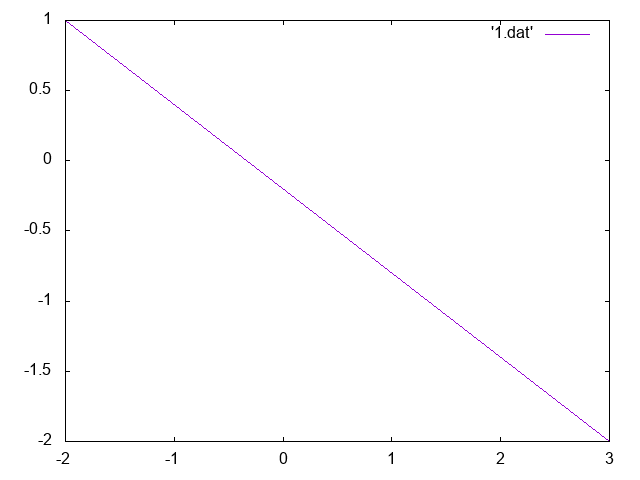
For these demos we will be using text files to store 2D point positions and will load them into gnuplot to draw, to get started create the following file
touch line.dat
Open line.dat in an editor and add the following code
# is used for comments
# this indicates the format of the data
# X Y
-2.0 1.0
3.0 -2.0
Next we need to add an alias into our .bashrc so we can use gnuplot
alias gnuplot='/public/bin/gnuplot/bin/gnuplot'
Save the .bashrc and source ~/.bashrc In the shell type gnuplot and you should see the gnuplot > prompt, at the prompt enter the following code to plot our data file
gnuplot> plot 'line.dat' with lines
Which should give you the following image
Random points
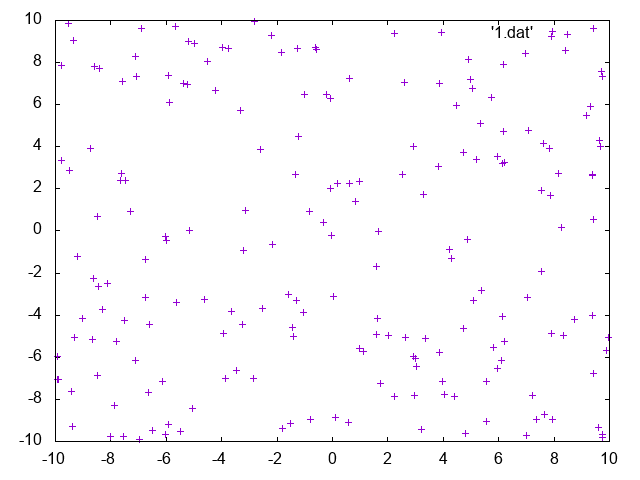
The following program will generate a series of random points using the new C++ 11 random features this should now always be used instead of rand as rand should now be considered harmful!
/// to compile use clang++ -Wall -g -std=c++11  random.cpp -o rand
#include <iostream>
#include <cstdlib>
#include <random>

int main()
{
  std::random_device rd;
  std::default_random_engine randEngine(rd()) ;
  std::uniform_real_distribution<> dist(-10, 10);

  std::cout<<"# X Y \n";
  for(int i=0; i<200; ++i)
  {
    std::cout<<dist(randEngine)<<' '<<dist(randEngine)<<'\n';
  }
  return EXIT_SUCCESS;
}
Once the program is compiled execute and pipe the output to a file using the following command line
./rand &>rand.dat
The file can now be plotted in gnuplot using the following
gnuplot> plot 'rand.dat'
And will give the following result
Exercises
Circle
The parametric equation for a circle can be generated using the following algorithm
get radius as double
set t = 0.01
for t=0.0 -> 2 * M_PI
  x=radius*cos(t)
  y=raduys*sin(t)
  output x y
  t+=step
Write a C++ program to output to the console the values for x and y into circle.dat using the following C++ commands
- std::cin to read in a radius
- std::cout to print the data to the shell
- M_PI, cos and sin are defined in <cmath>
Multiple Plots
It is possible to plot more than one column of data in a single plot by using the following format
0 0 1
0.01 0.0627905 0.998027
0.02 0.125333 0.992115
Then with gnuplot use the command
gnuplot> plot 'sine.dat' using 1:2 with lines , 'sine.dat' using 1:3 with lines
Write a program that requests two inputs from the user one for frequency and one for amplitude, and then plots both the cos and sine waves for the given values using the algorithm
for x=0 x<range x+=0.1
  ys=amplitude*sin(freq*M_PI*x)
  yc=amplitude*cos(freq*M_PI*x)
Writing to files
Using the examples above, modify the programs to write the data directly to a file, for more information on C++ file I/O routines use the following resources
3D
- Modify the random example above to generate 3D points, these may be plotted using the splot function
- investigate other algorithms for generating 3D points example and try to plot them
Solutions / Samples
Solutions and samples can be found here, please try to do it yourself first.